
Home Screen
Your streak.
Front and center.
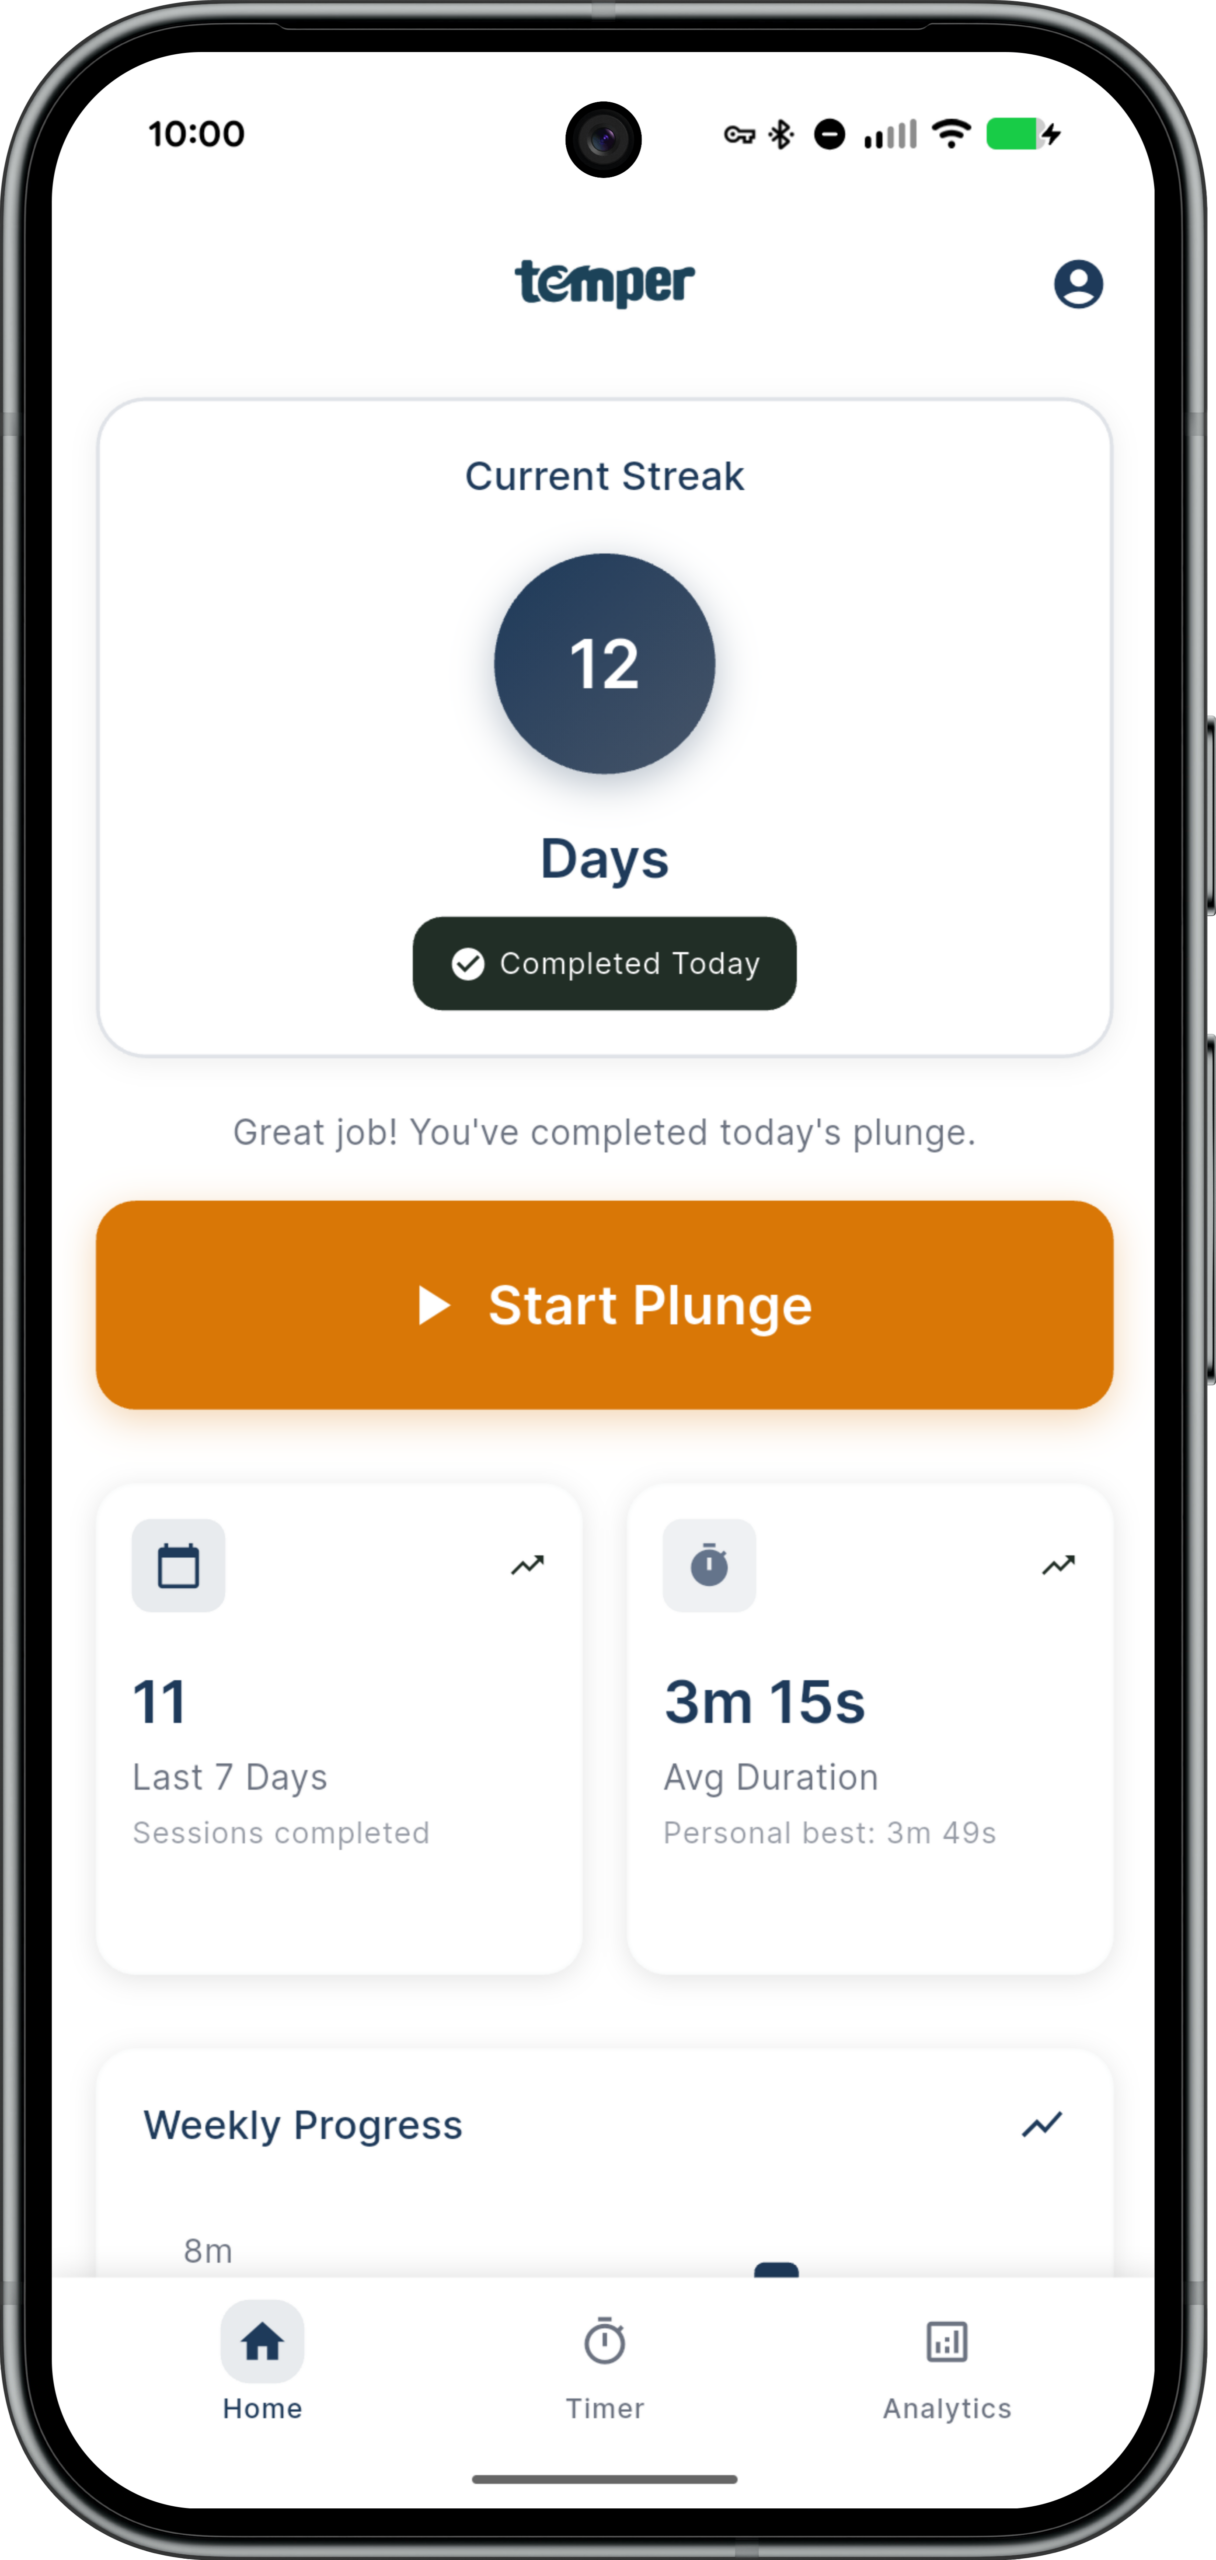
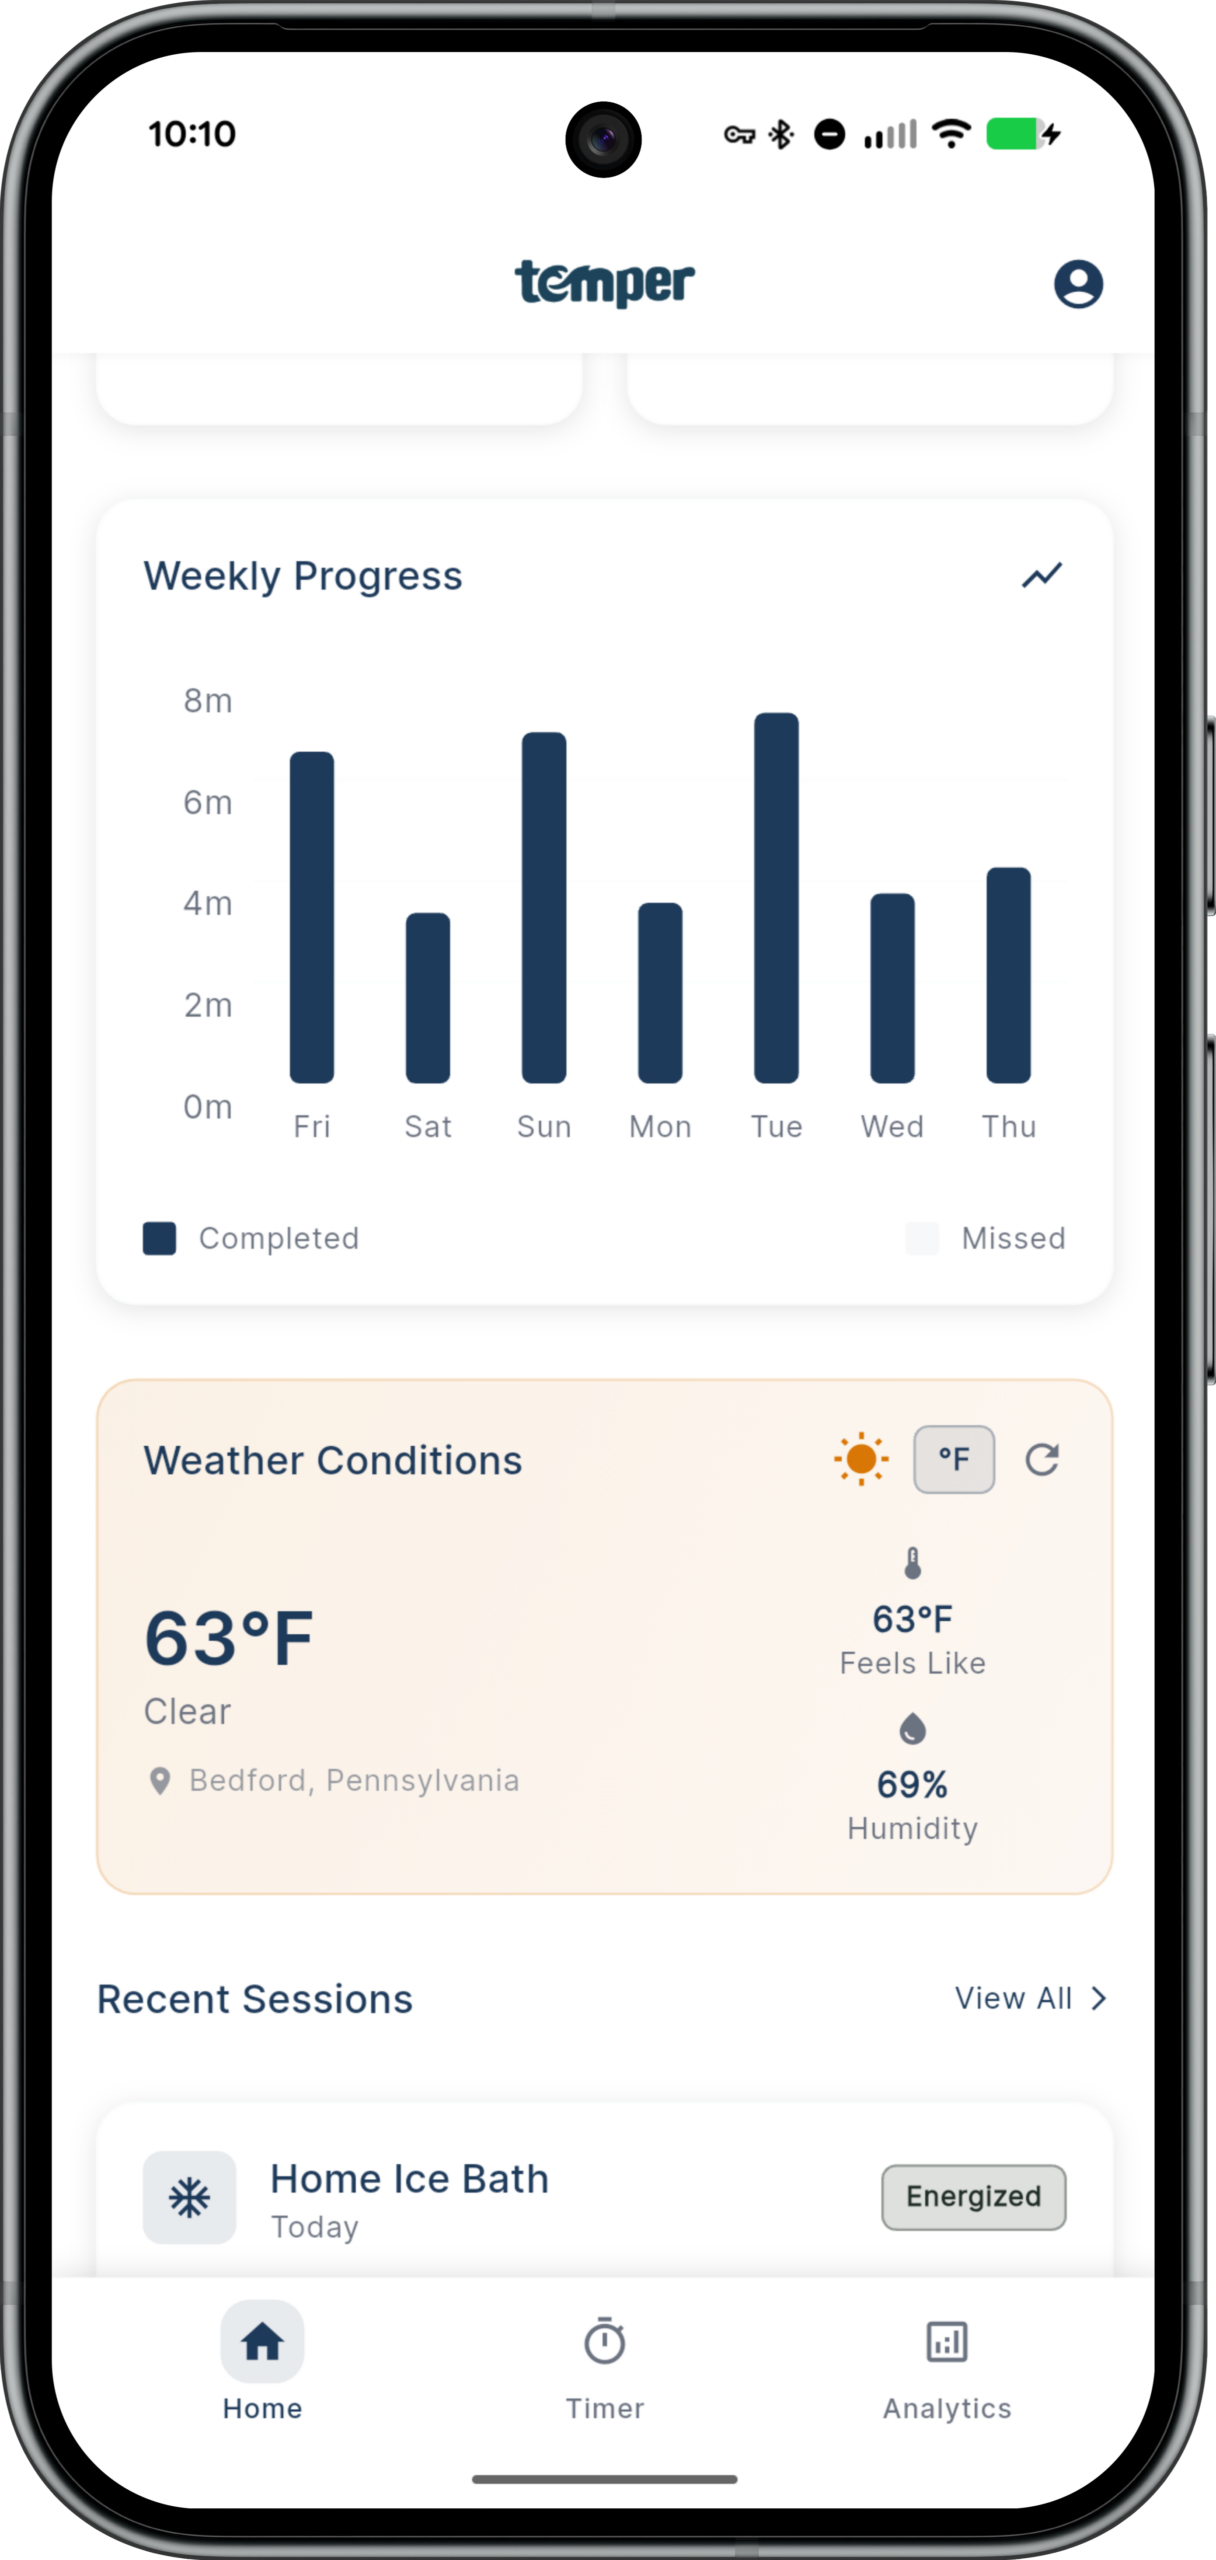
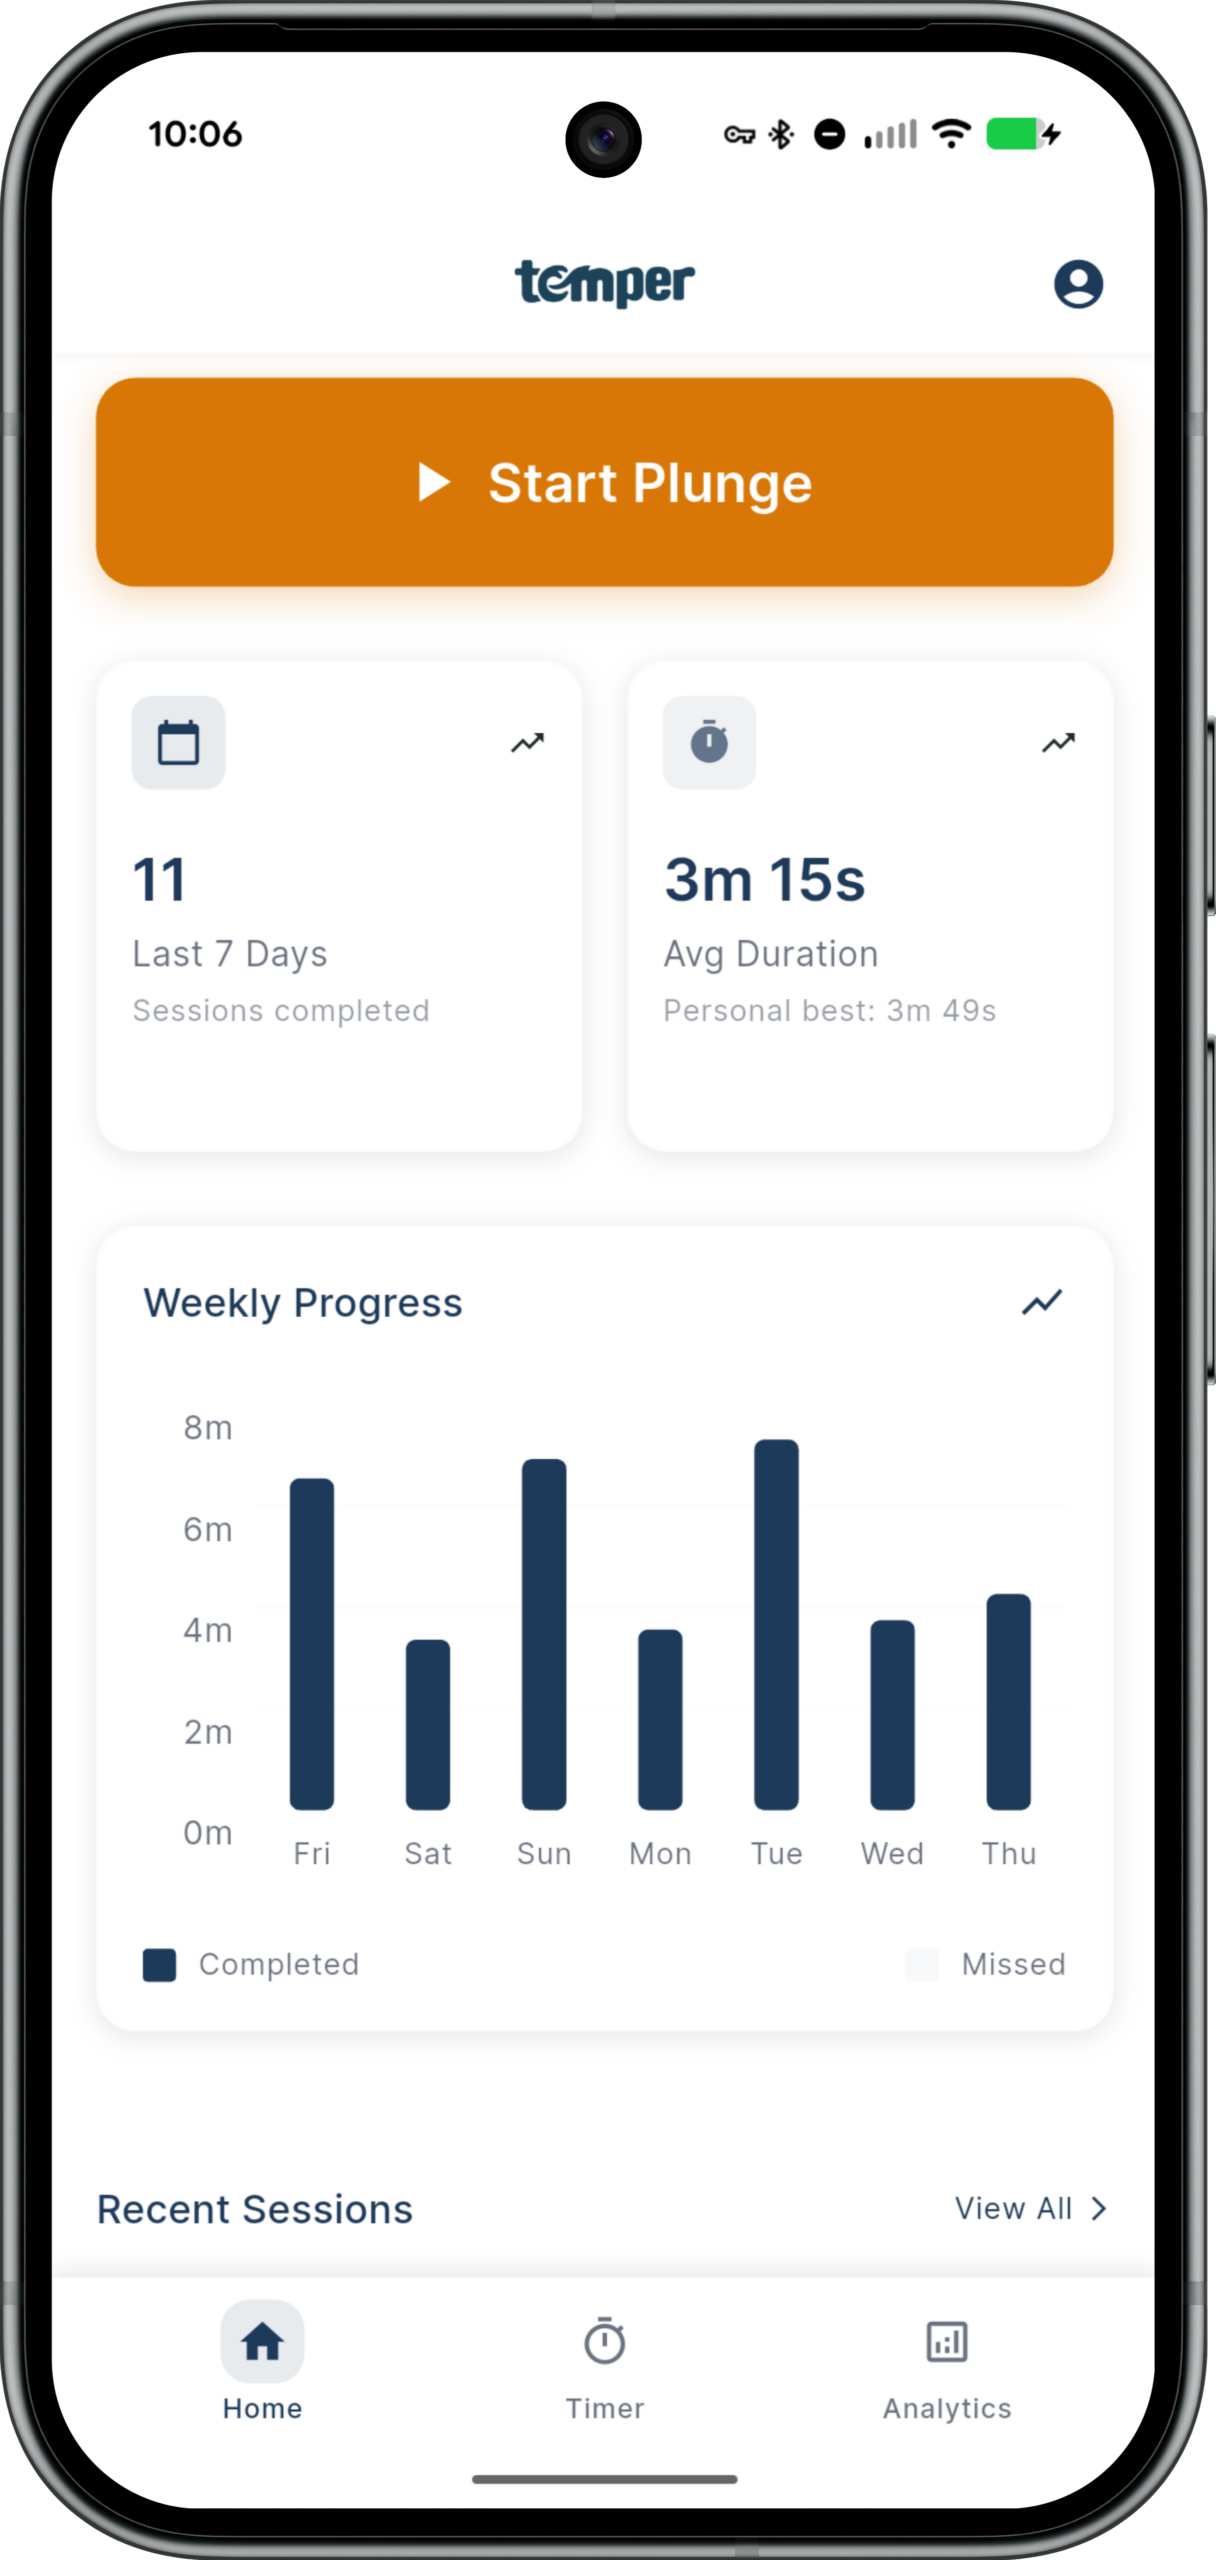
Every time you open Temper, you see exactly where you stand. Pending or complete — one clear signal. Weekly progress, average duration, and personal best always a glance away.
- Current streak with pending / completed state
- Sessions completed in last 7 days
- Average duration + personal best
- Weekly progress chart (completed vs. missed)
- Live weather conditions by location
- Recent sessions preview with View All
Breathing + Soundscapes
Stay Calm.
Stay Longer.
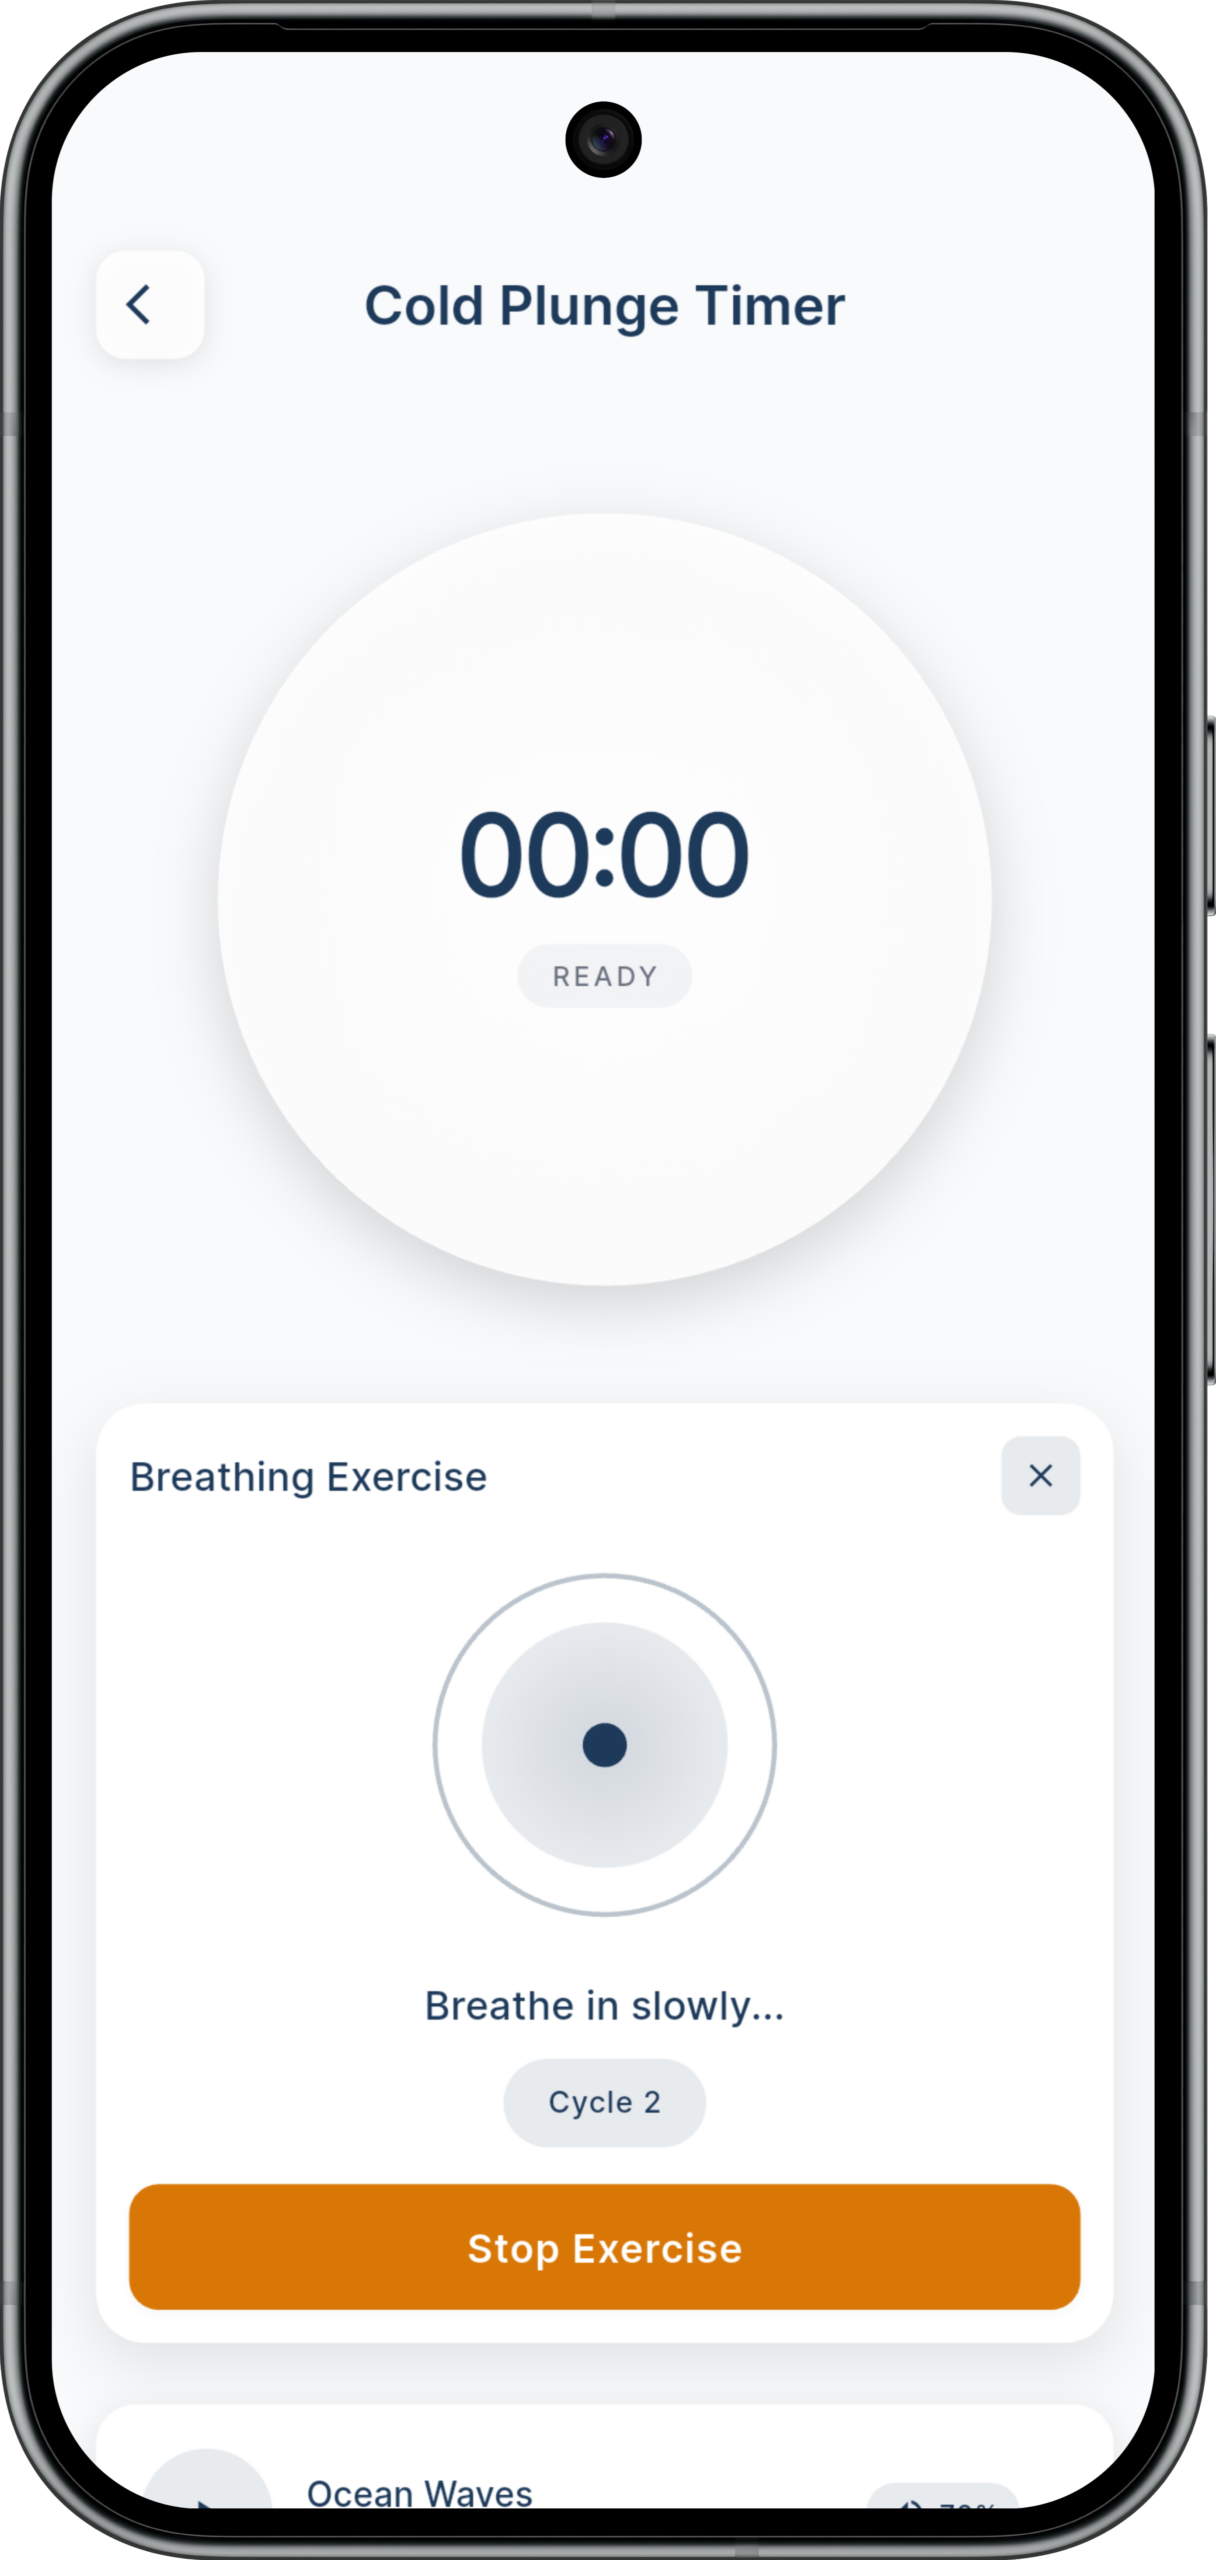
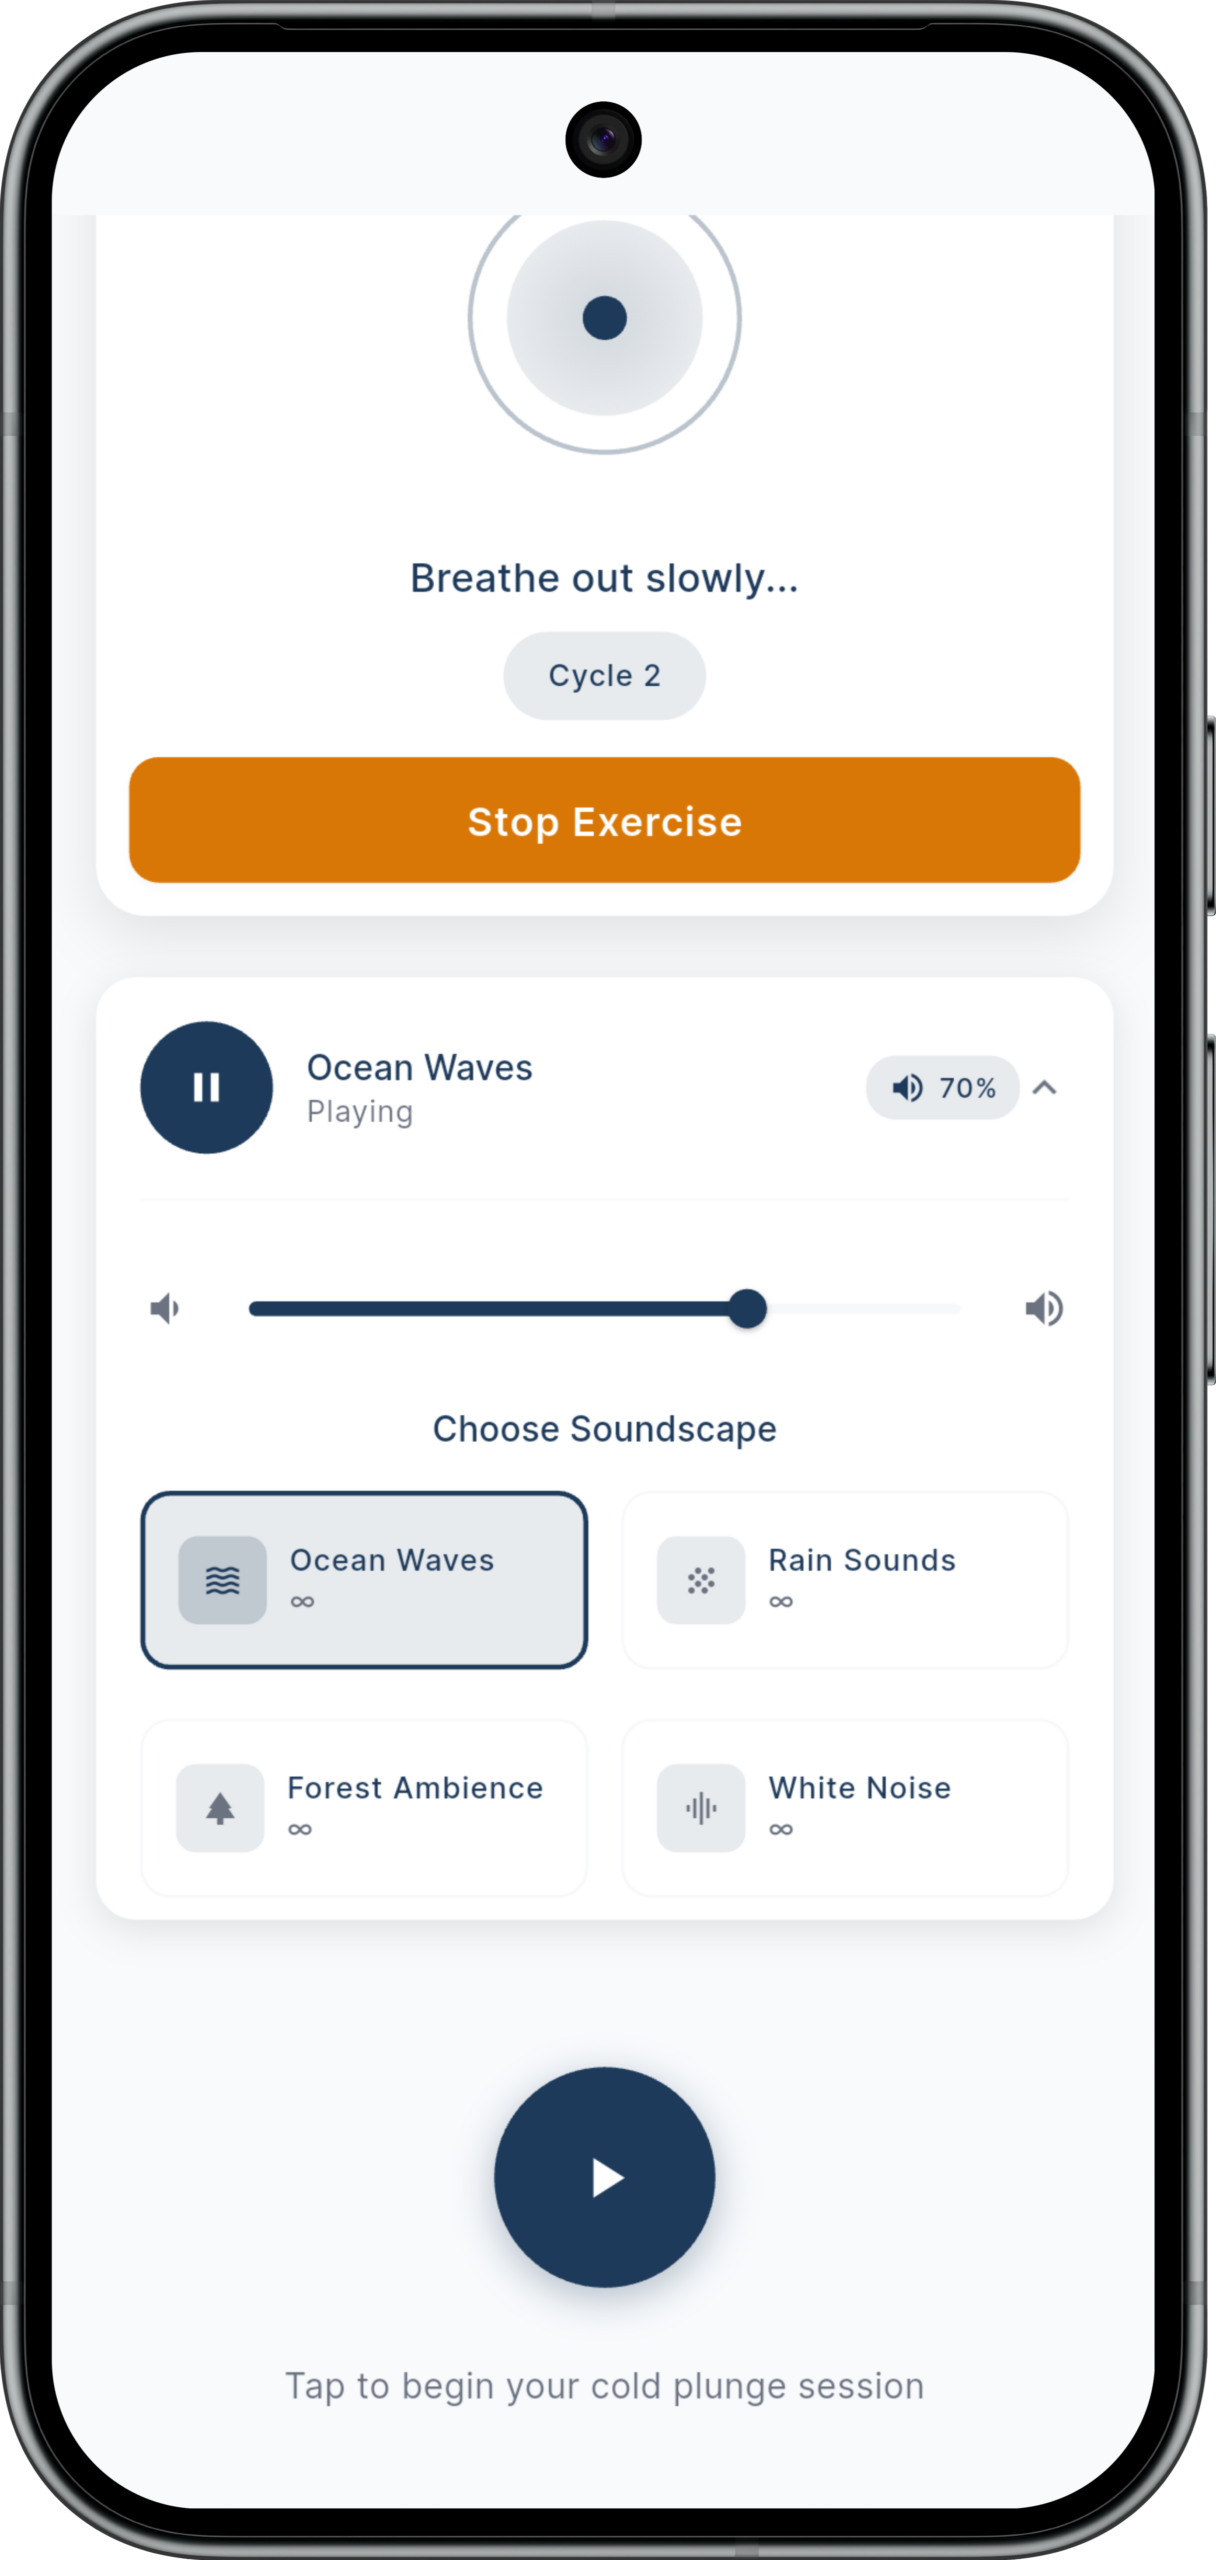
Guided breathing cycles keep your nervous system regulated while you're in the cold. Ambient soundscapes give you something to anchor to. Together they make longer sessions possible.
- Animated breathing guide with inhale / exhale cues
- Cycle counter visible during session
- 4 soundscapes: Ocean Waves, Rain, Forest, White Noise
- Volume slider + play/pause controls
- Breathing guide accessible while timer is running
Session Setup + Timer
Configure.
Countdown.
Get In.
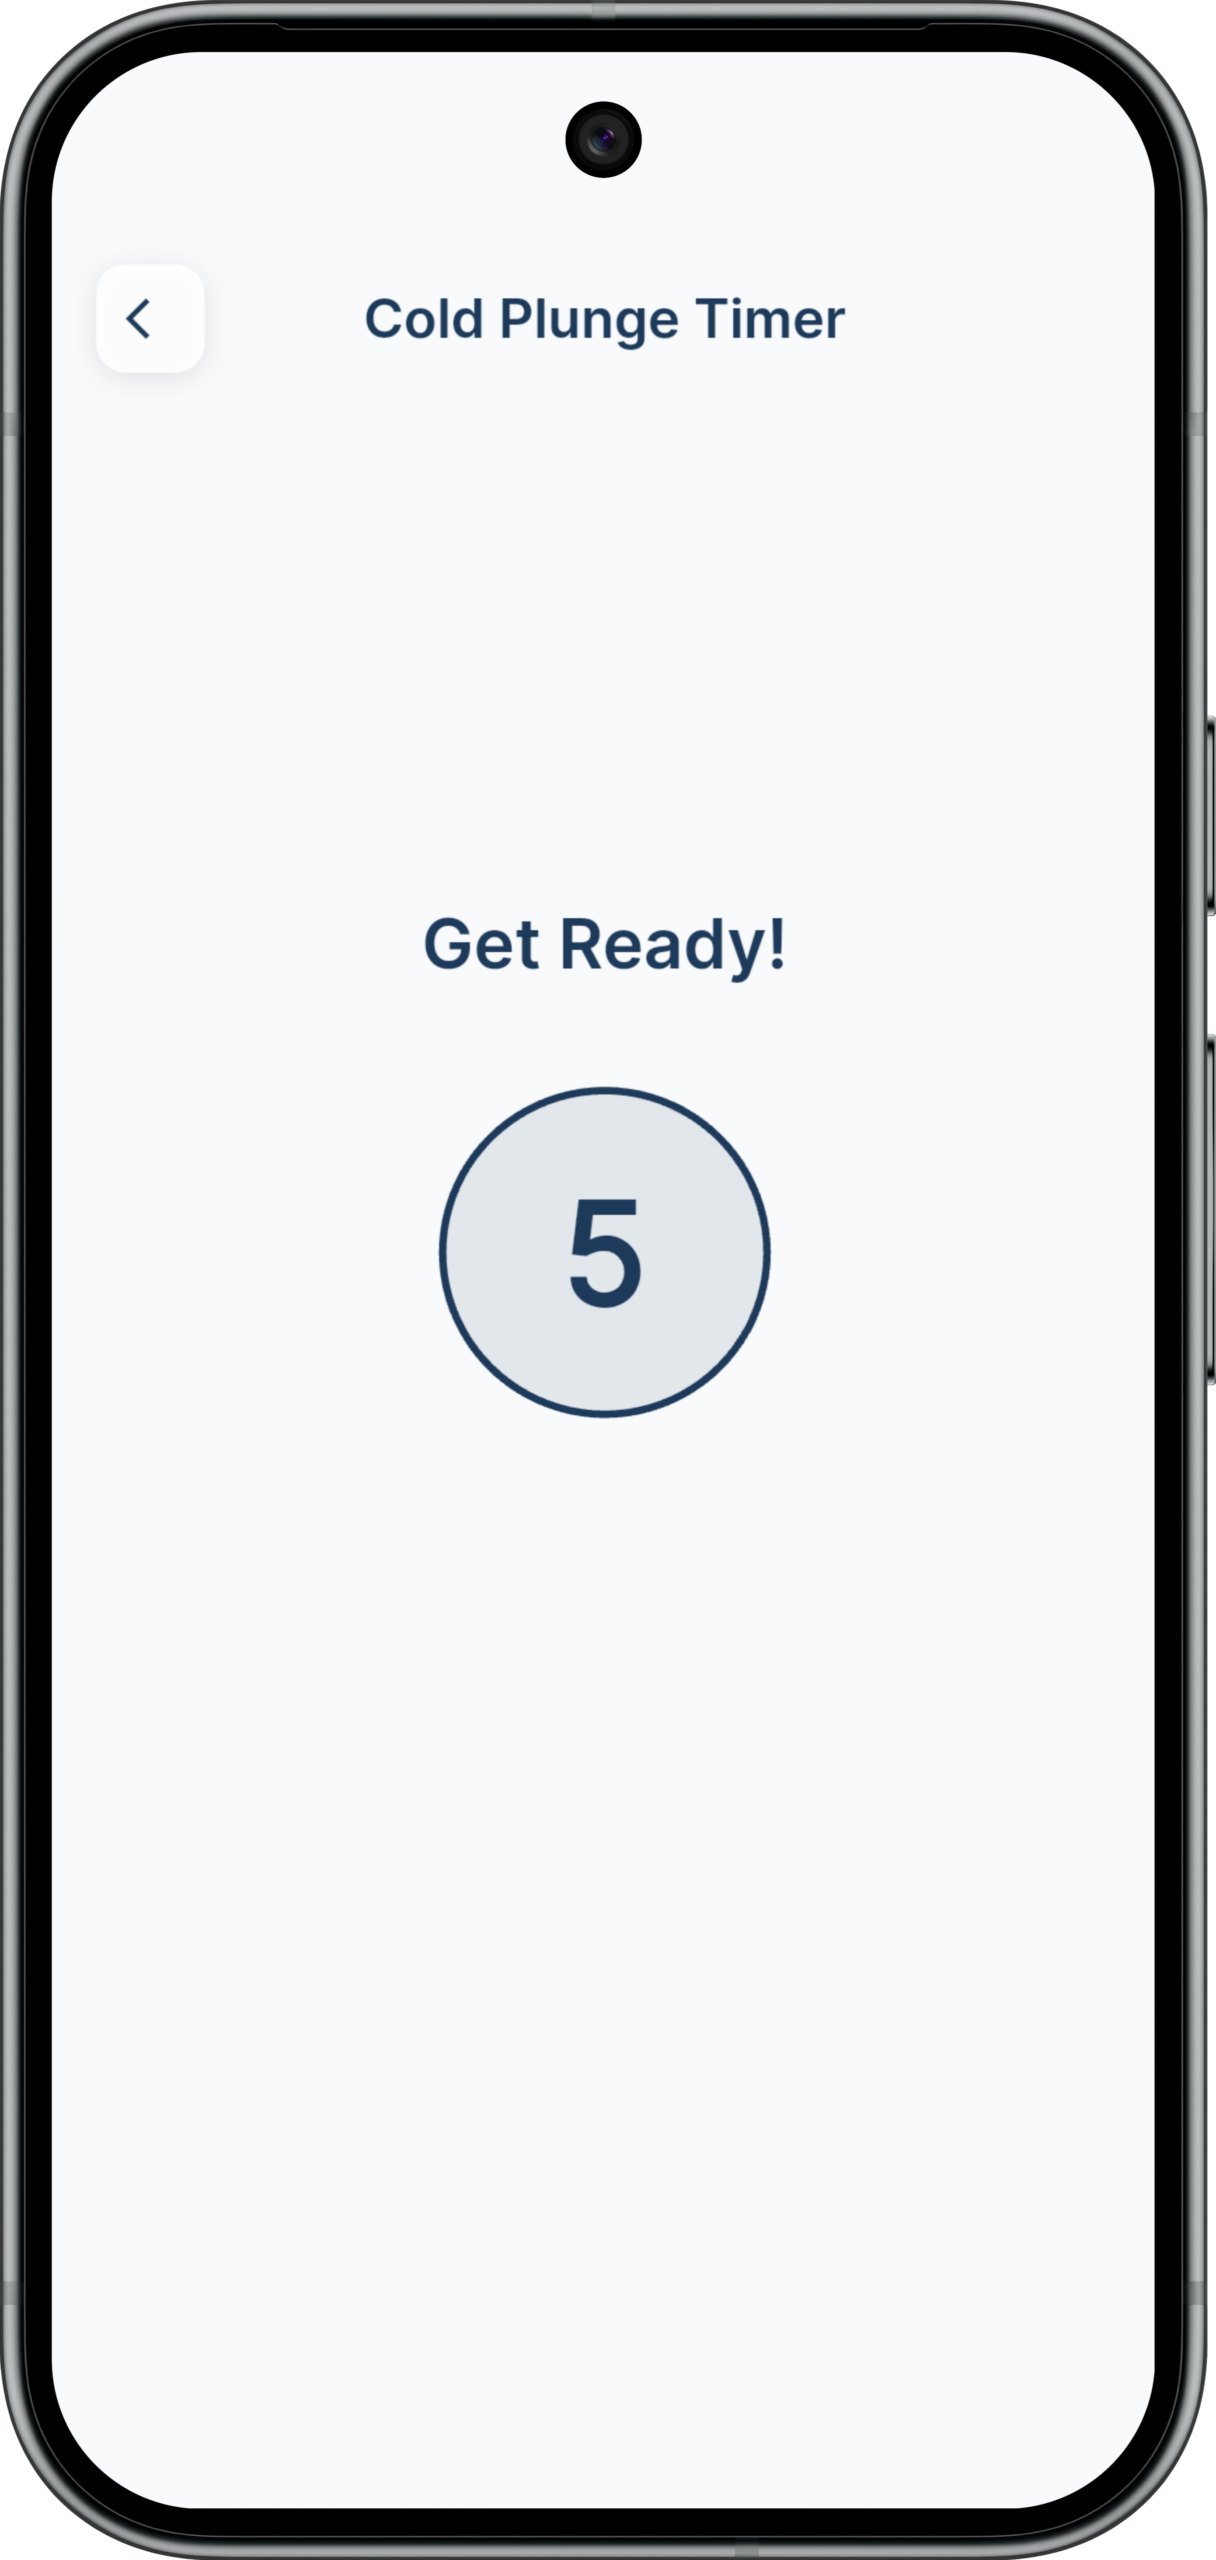
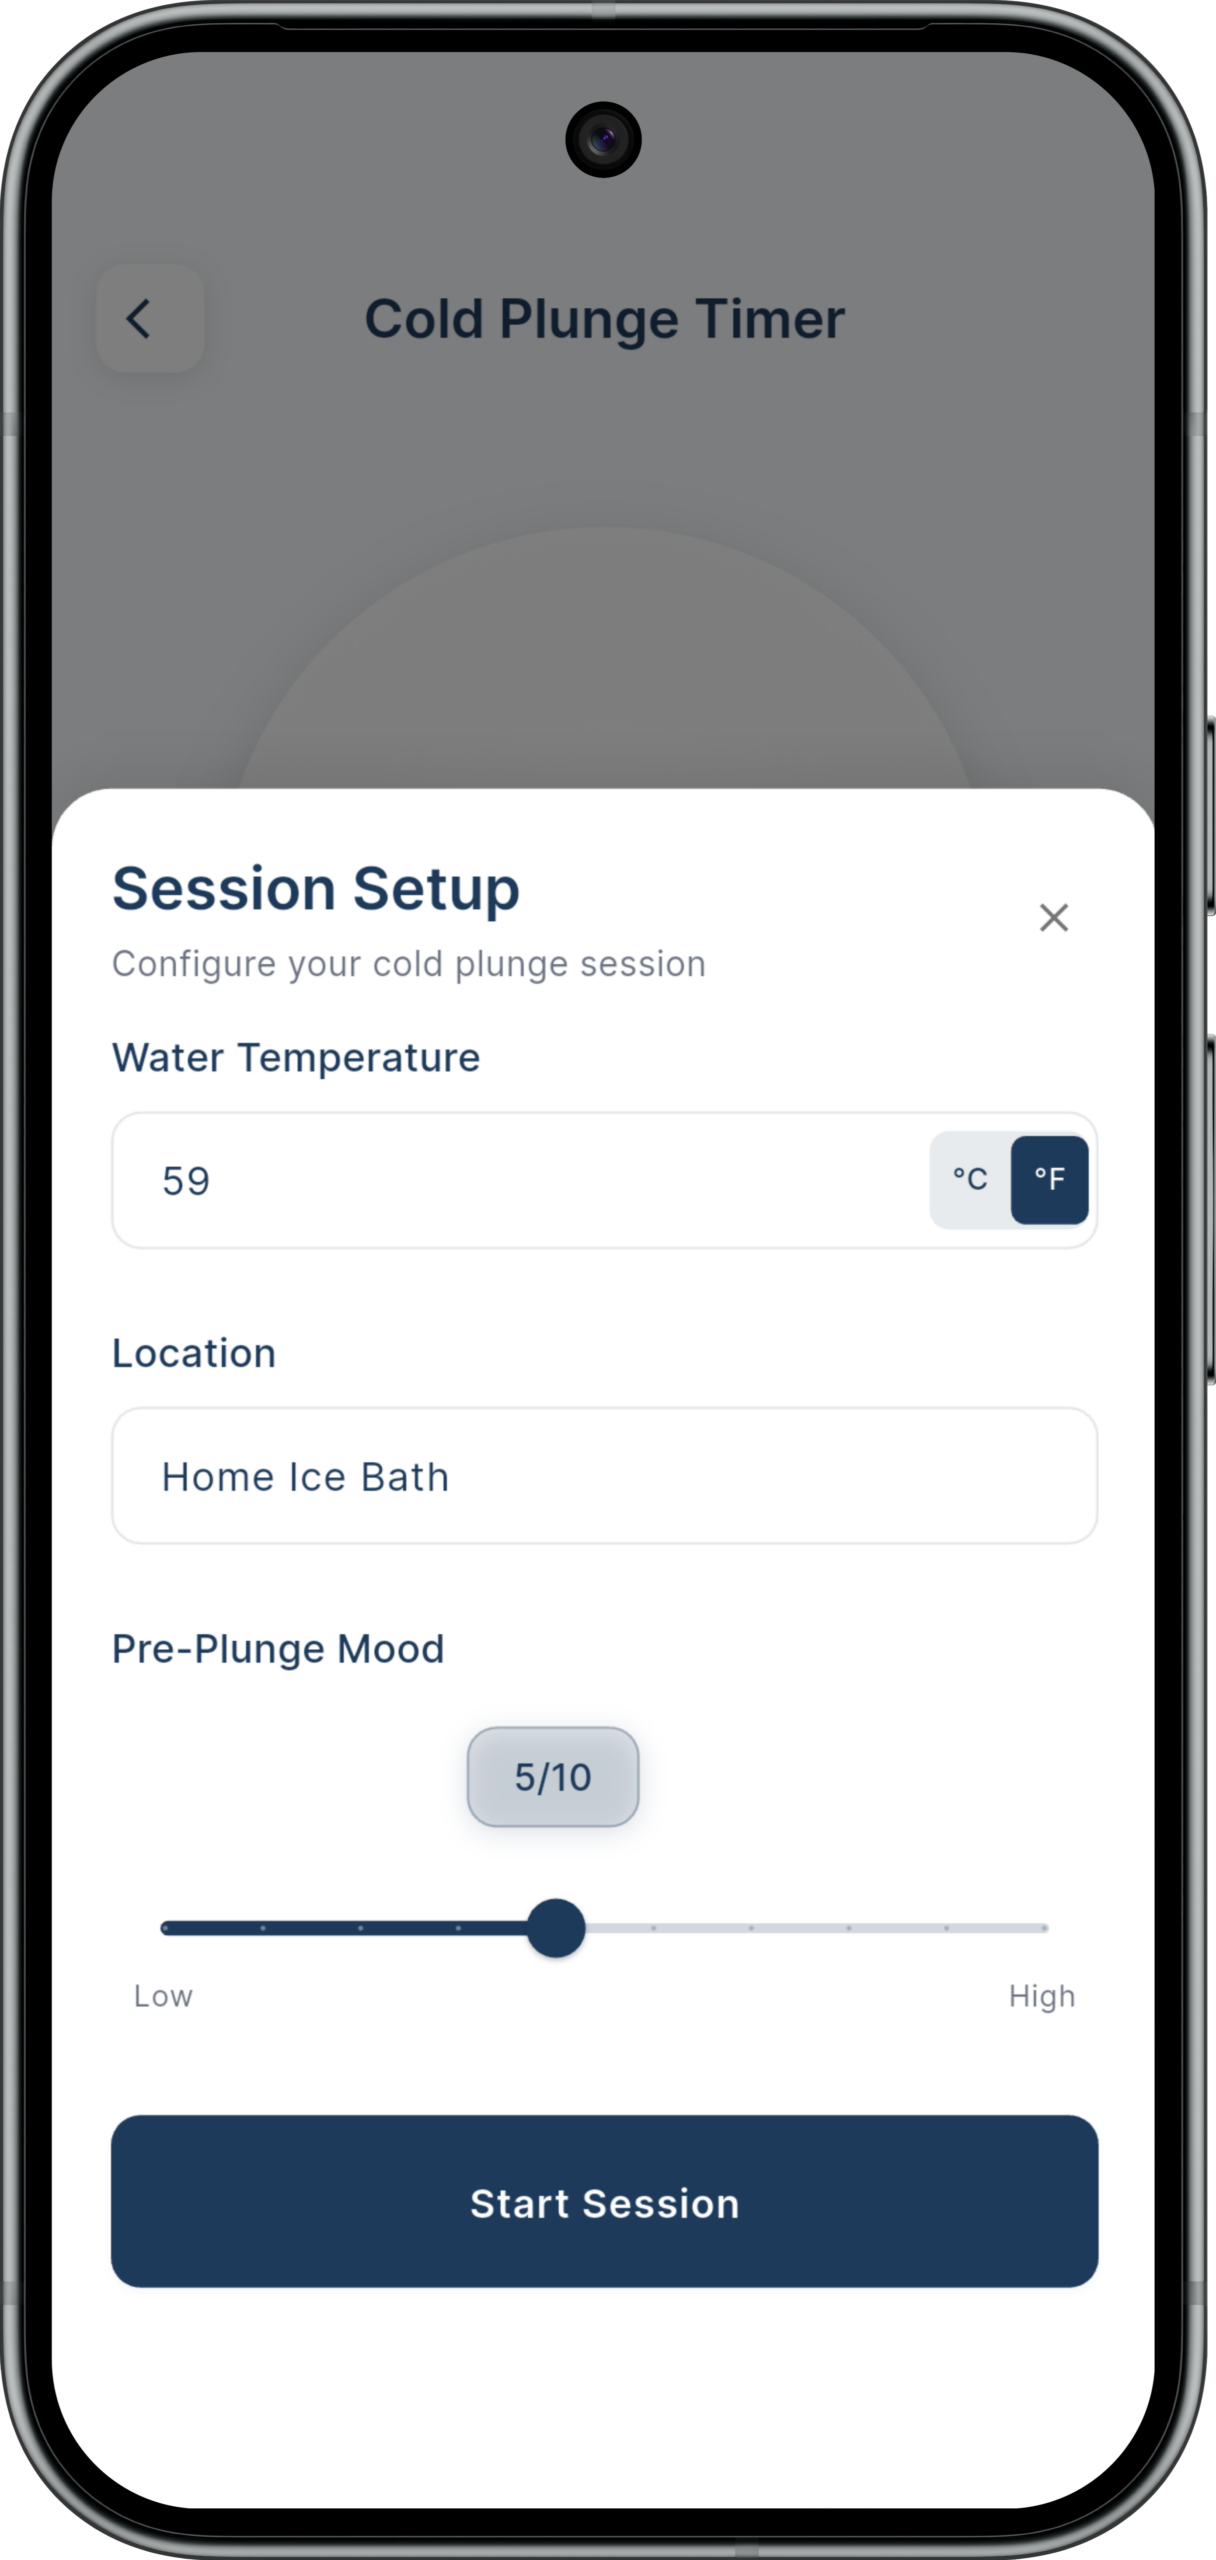
Set your water temperature, name your location, and rate your pre-plunge mood — then tap Start. A 5-second countdown prepares you mentally. Then the clock runs.
- Water temperature input with °F / °C toggle
- Custom location naming
- Pre-plunge mood slider (1–10)
- 5-second get-ready countdown
Session Complete
Log it.
Feel it.
Own it.
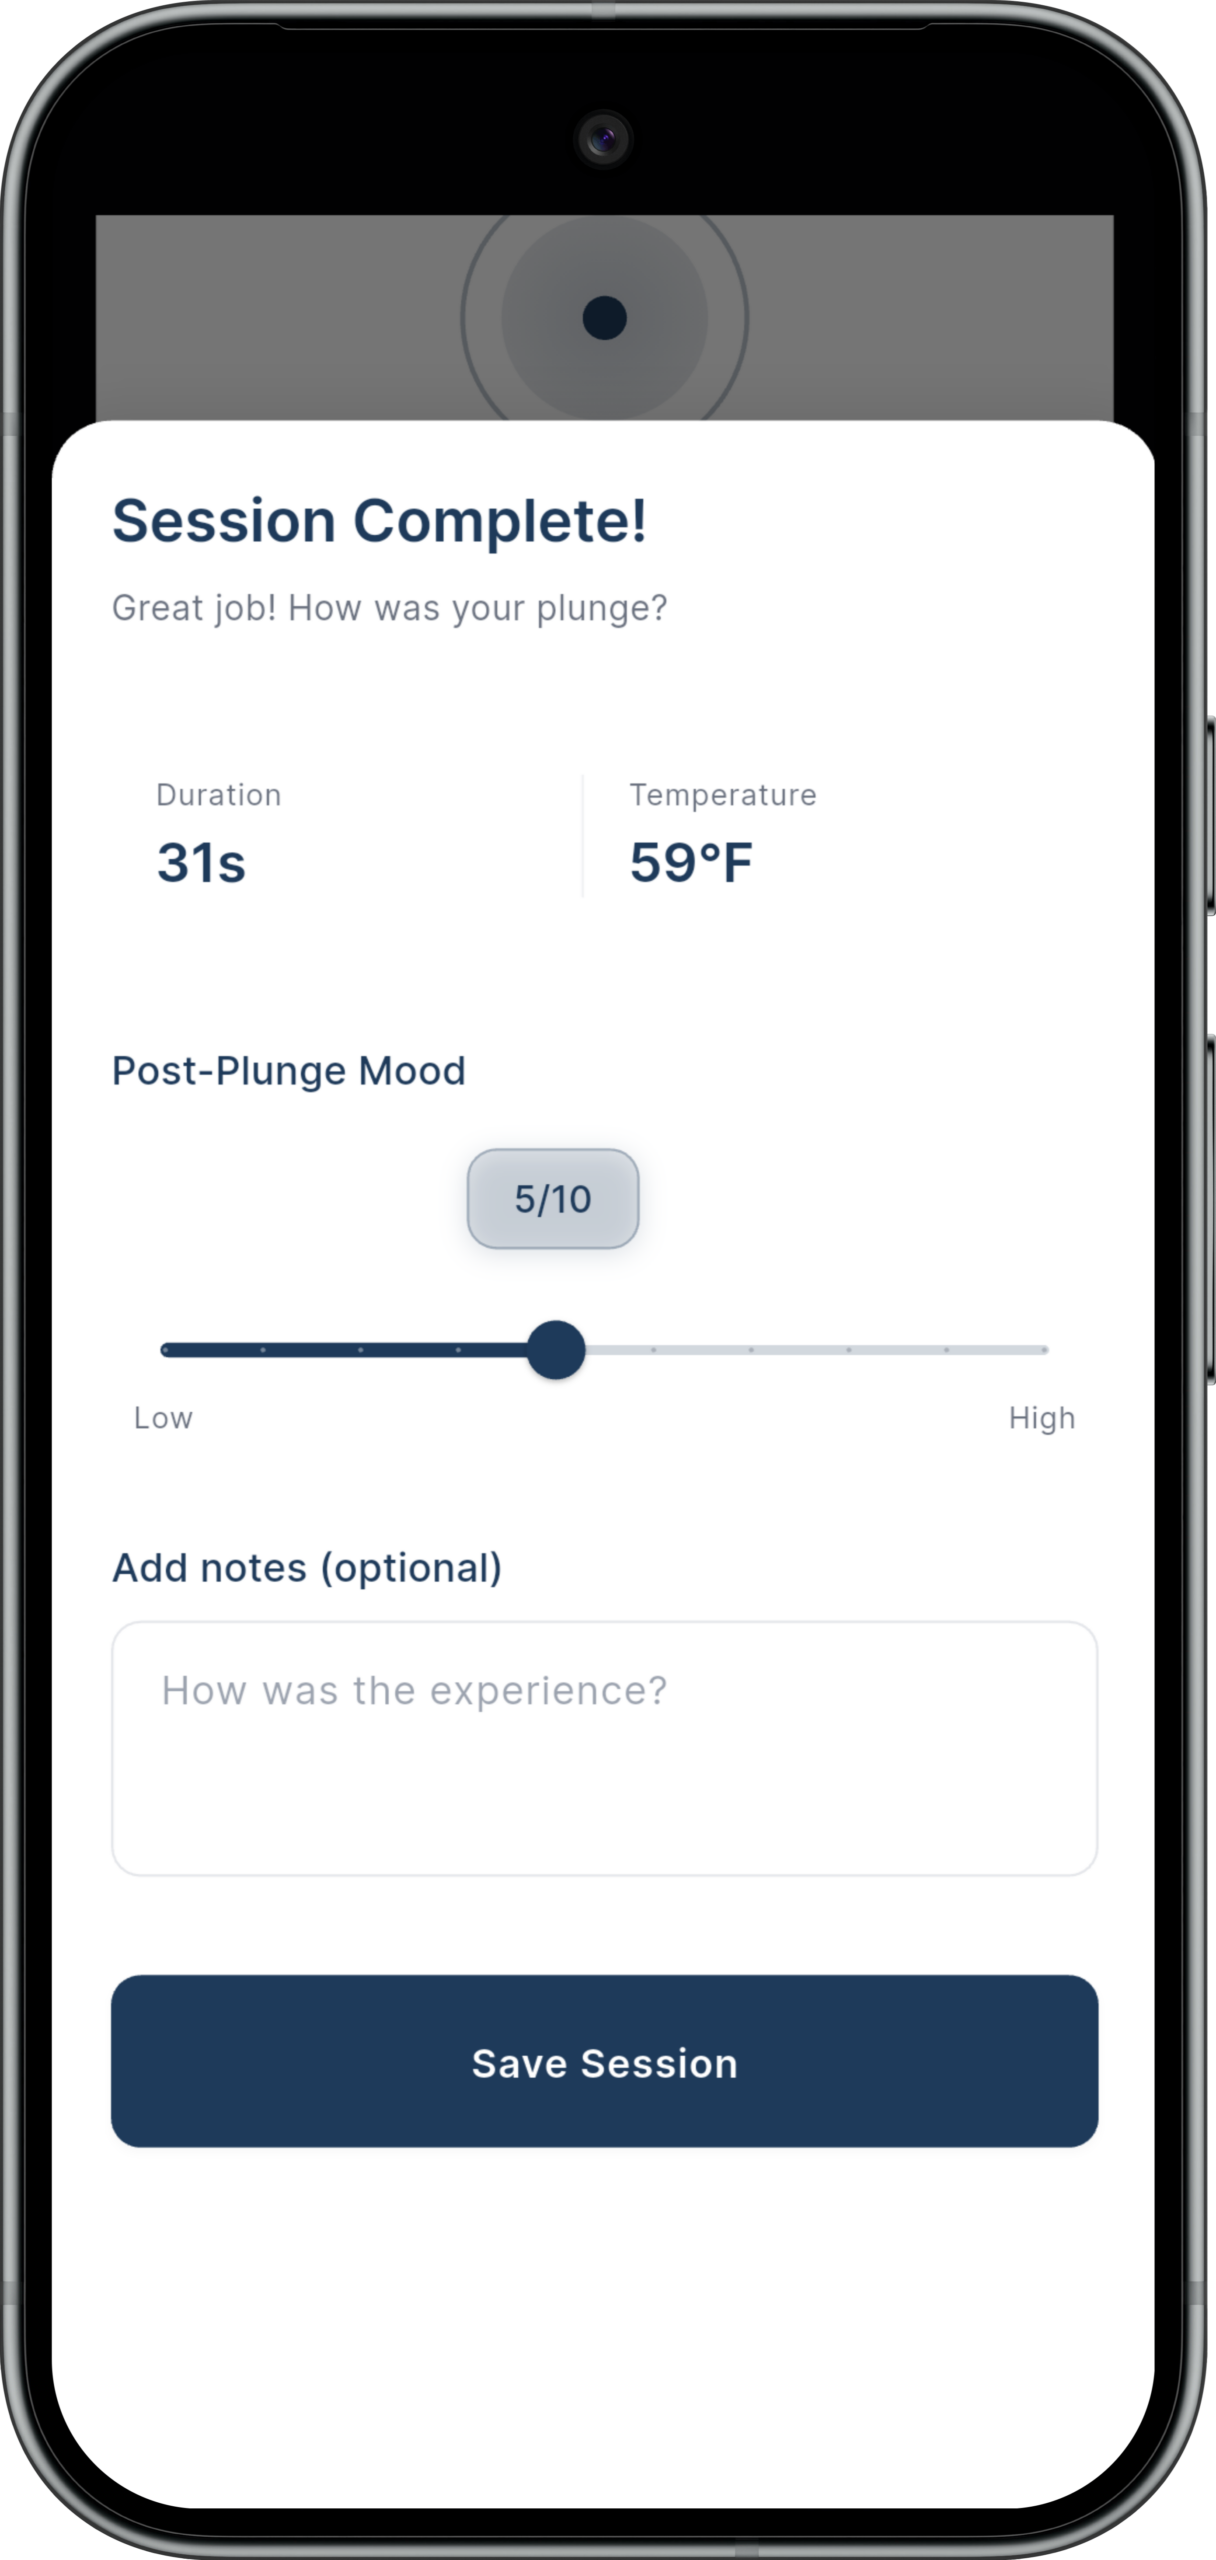
The moment you get out, Temper shows you what you just did. Rate your post-plunge mood, add an optional note, and save. Your streak updates in real time.
- Session summary: duration + temperature
- Post-plunge mood slider (1–10)
- Optional notes field
- "Session completed!" toast notification
- Streak counter updates immediately on save
Session History
Every plunge.
On record.
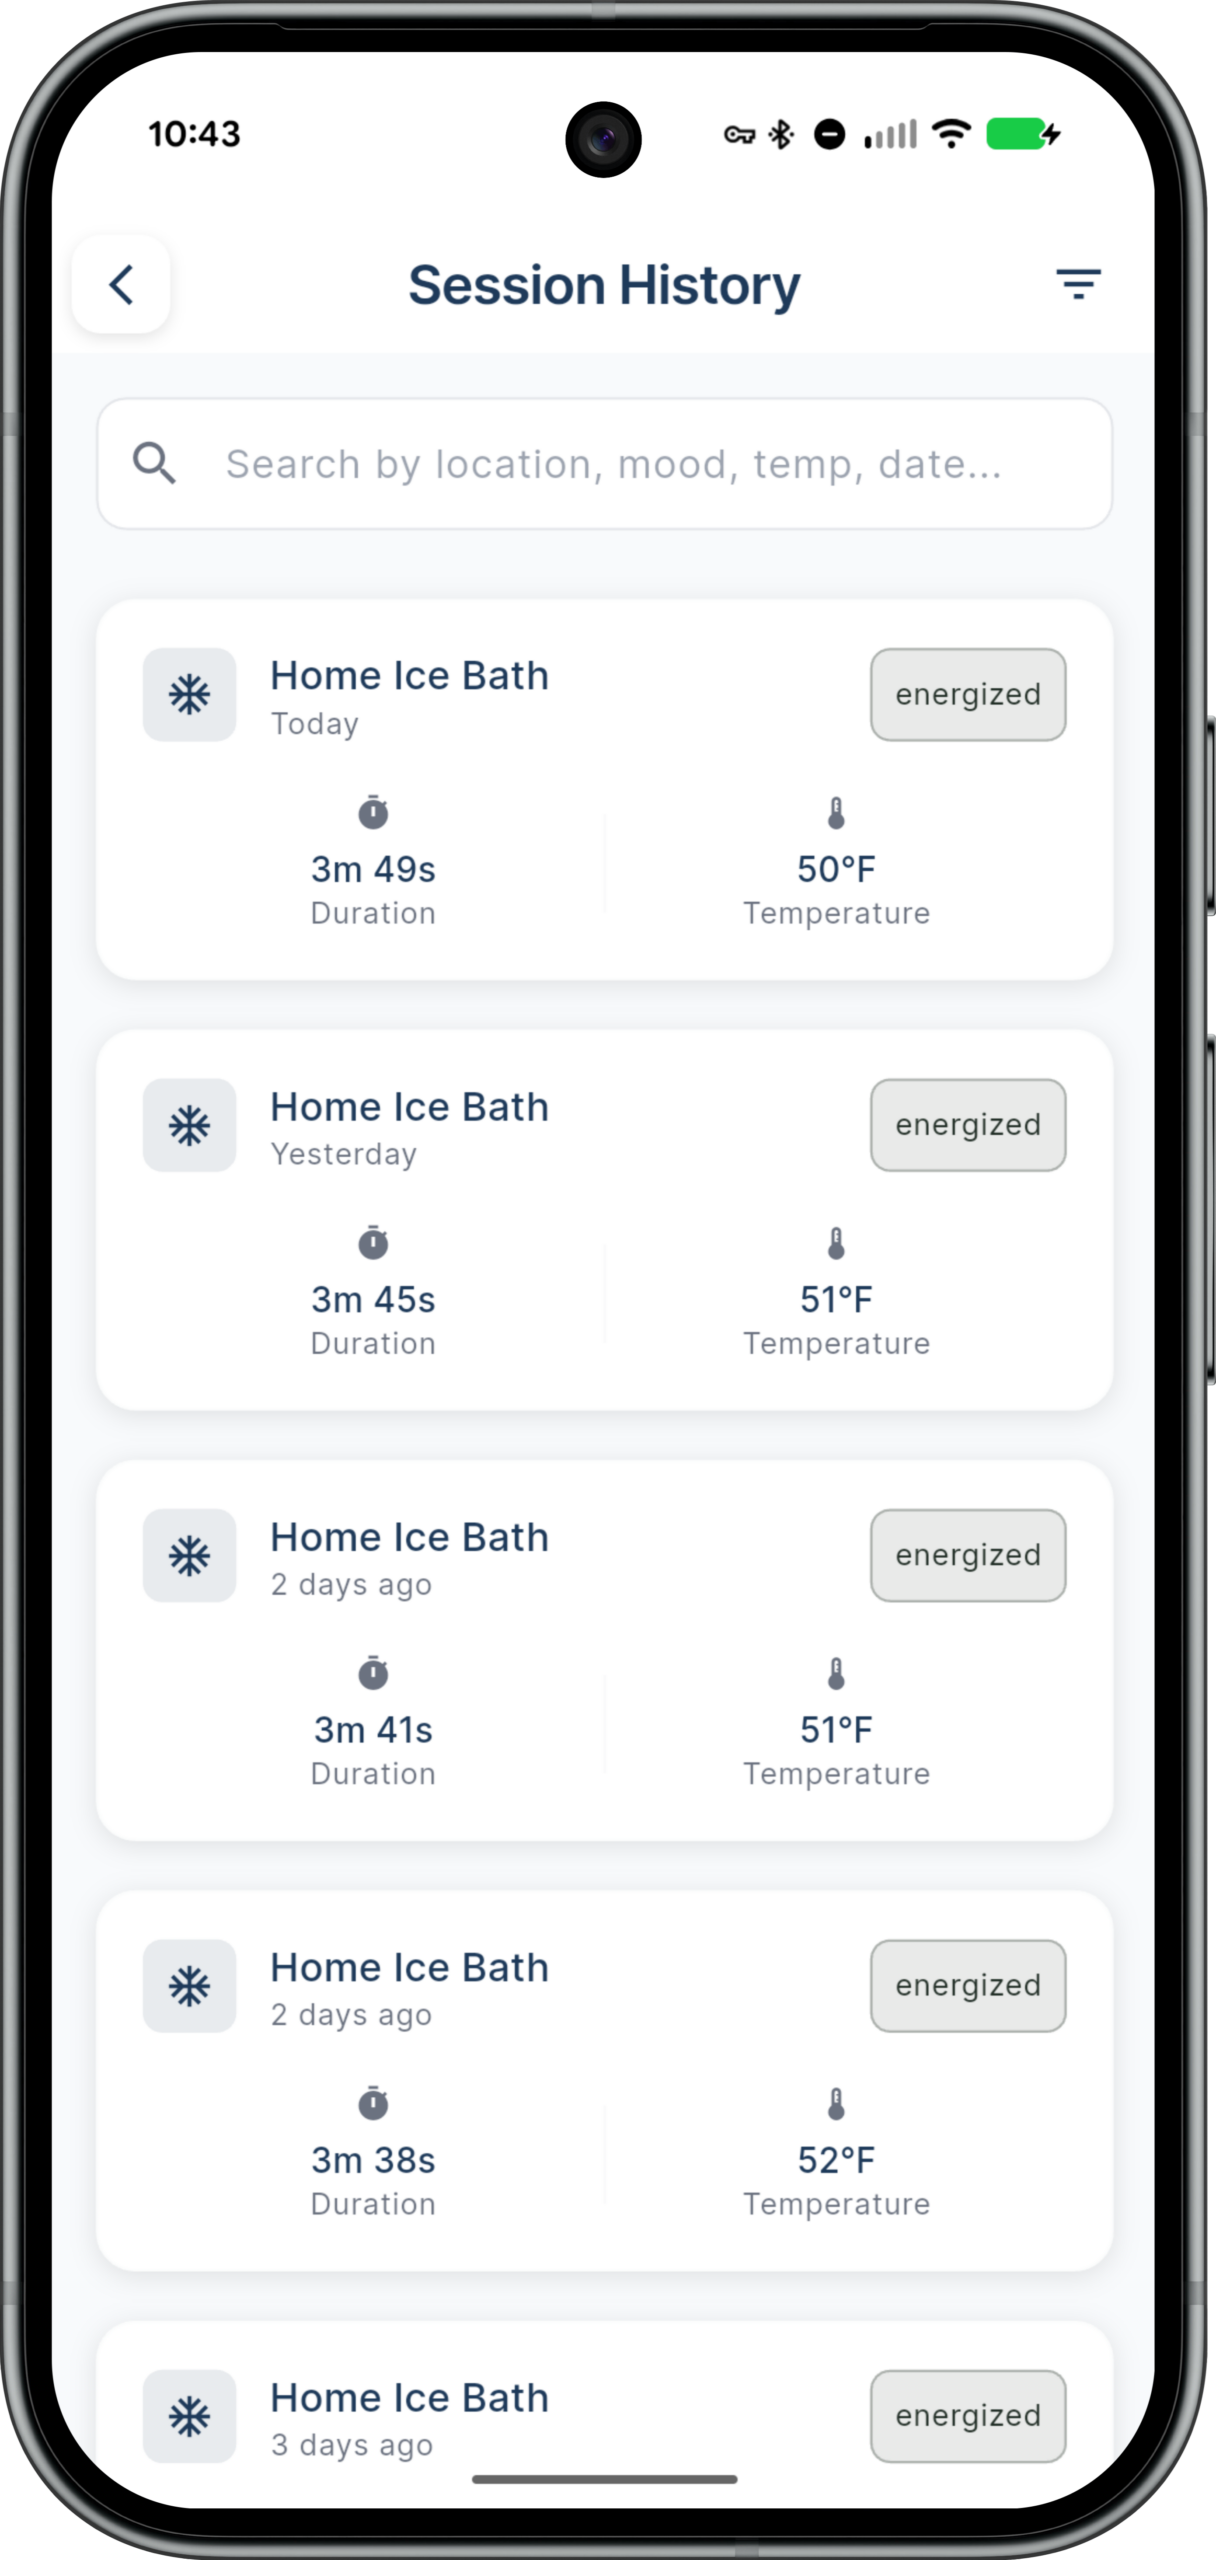
A full searchable log of every session you've ever done. Filter by location, mood, temperature, or date. Each card shows duration, temp, and mood tag.
- Full session history list, newest first
- Search by location, mood, temperature, or date
- Filter icon for advanced sorting
- Mood tags color-coded per entry
- Duration and temperature per card
Personal Analytics
The numbers
don't lie.
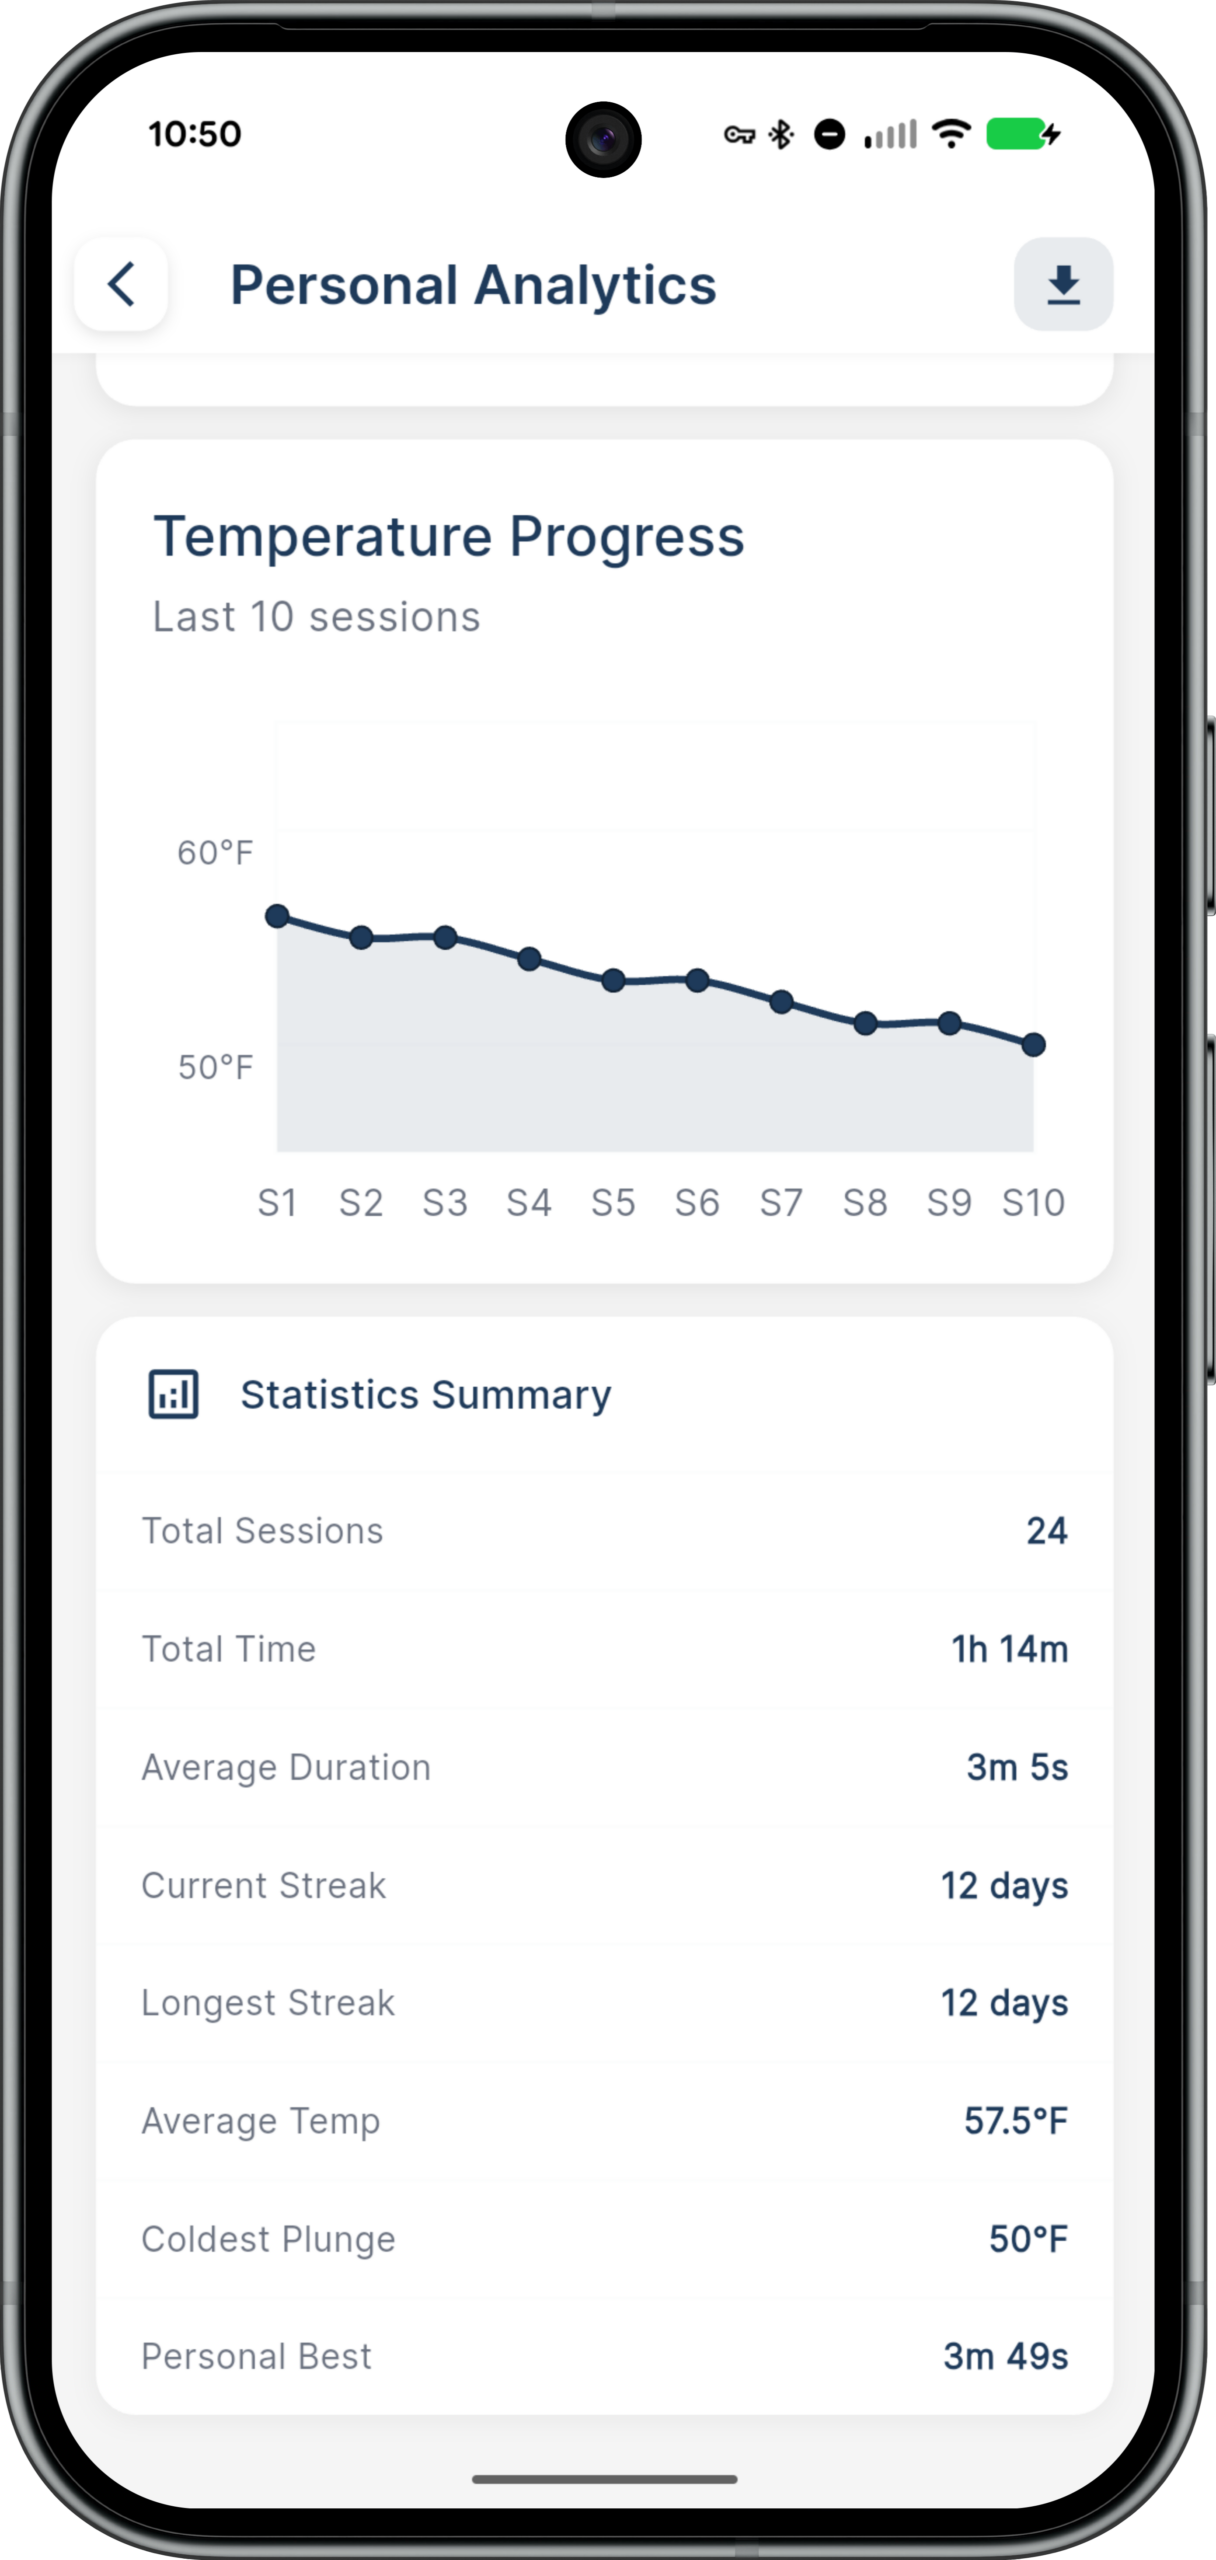
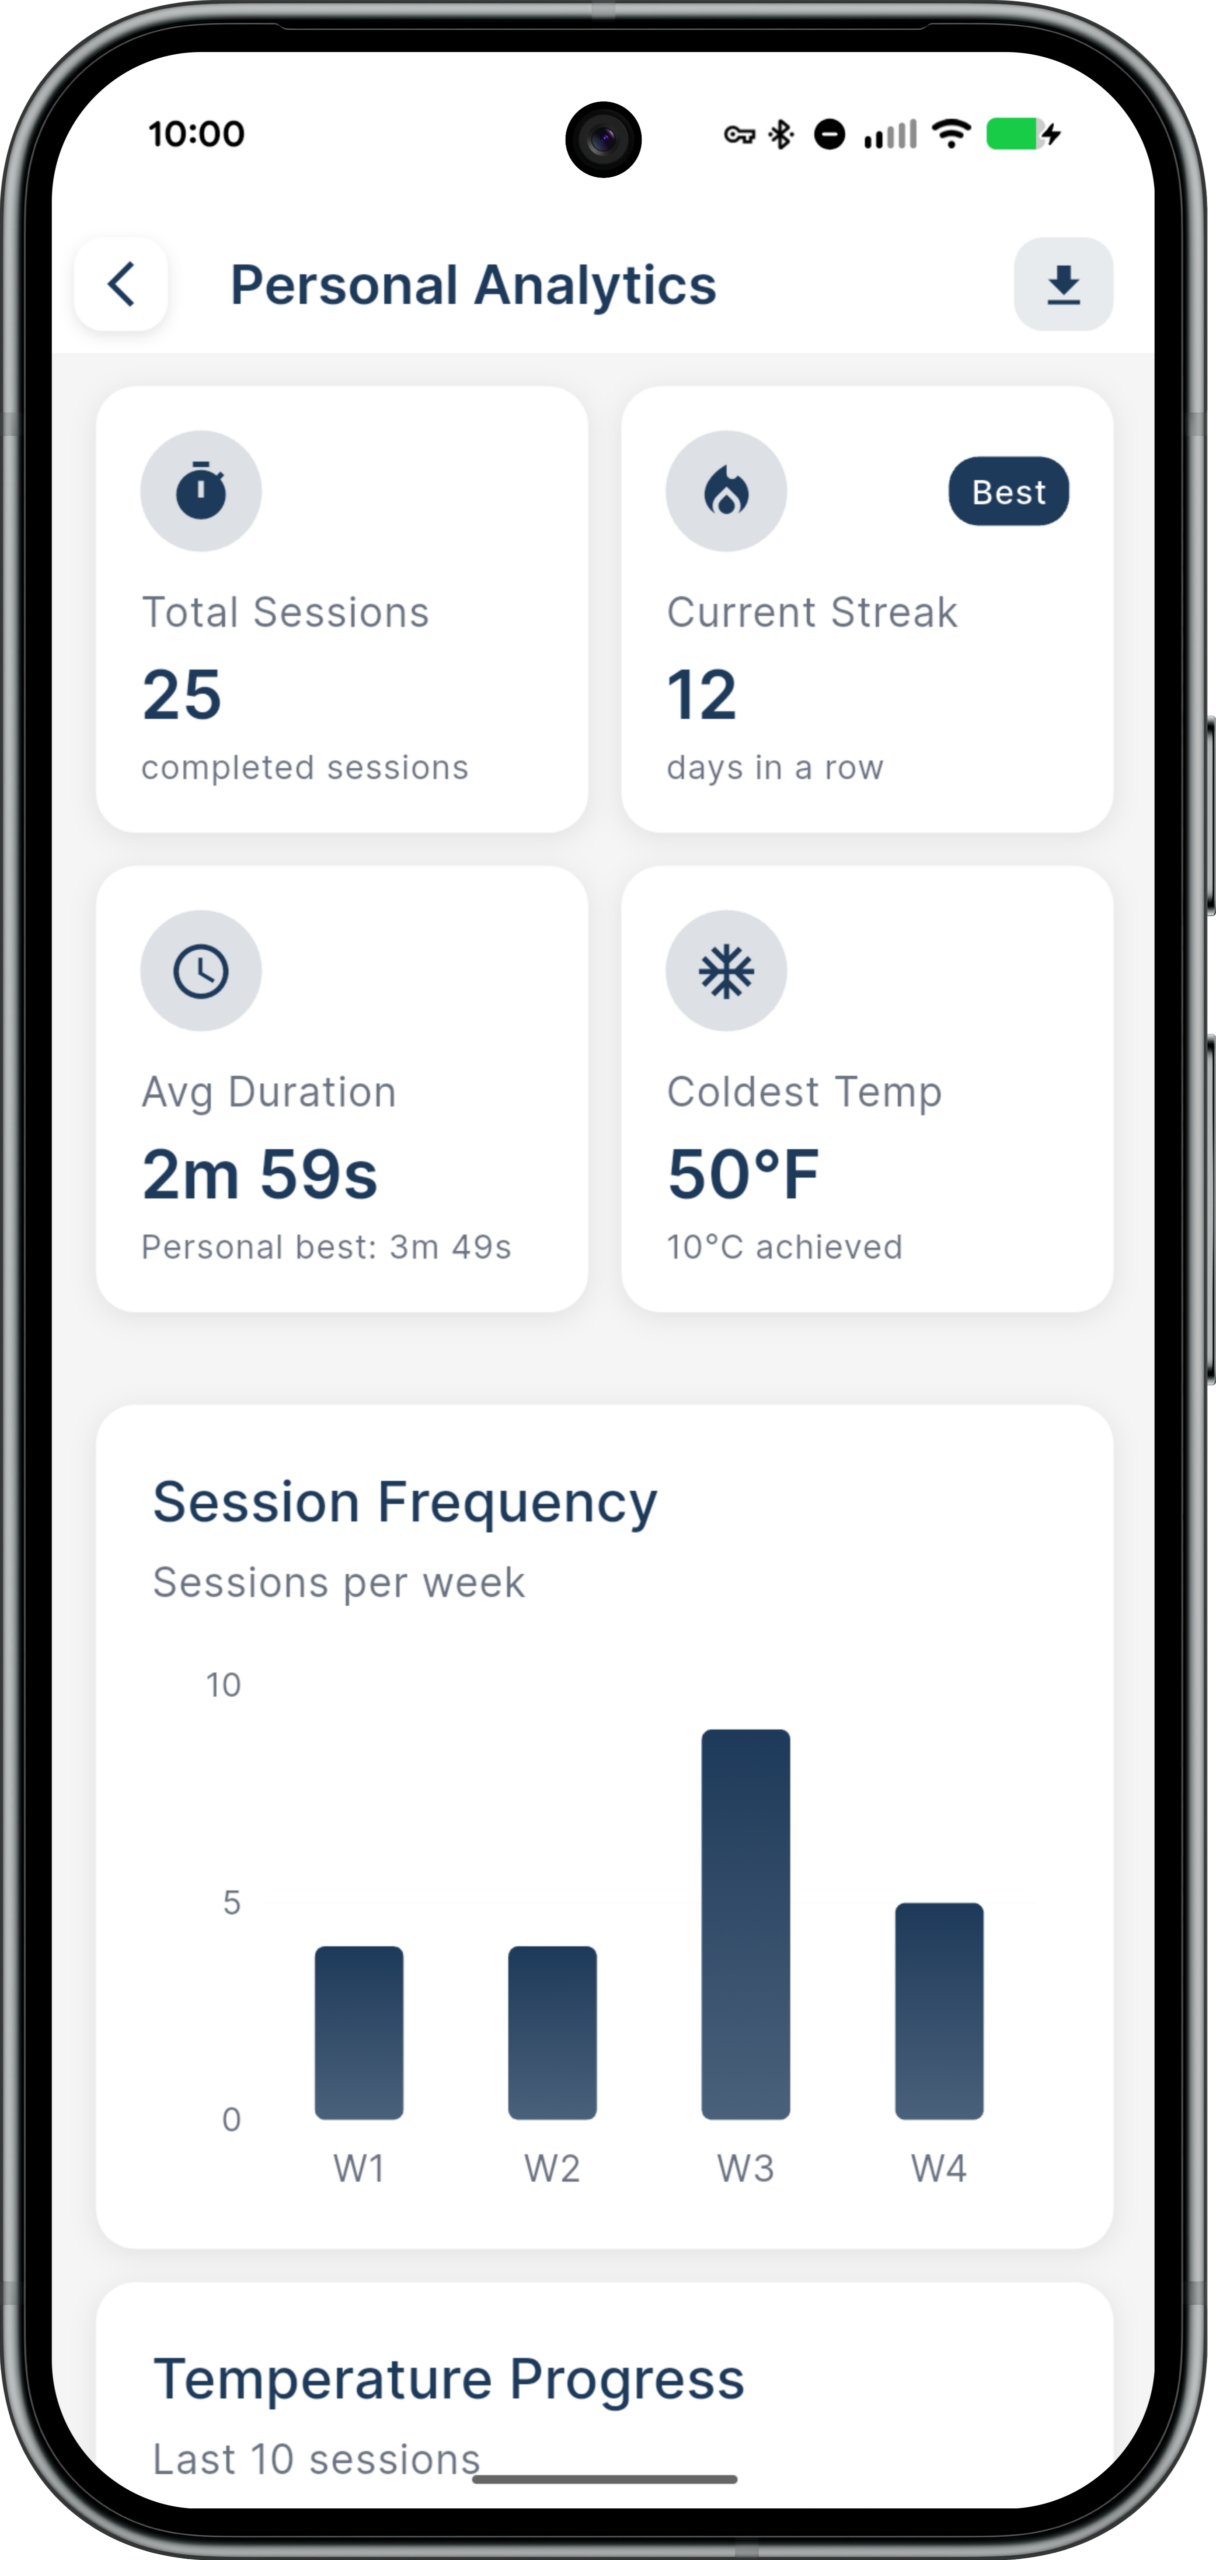
Your full stats at a glance — then in depth. Session frequency by week, temperature trend over your last 10 plunges, and a complete statistics summary.
- Stat cards: sessions, streak, avg duration, coldest temp
- Session frequency bar chart by week
- Temperature progress line chart (last 10)
- Summary: total time, averages, streaks, personal best
- Export / download button
Ready to build the habit?
© Copyright 2026. All rights reserved.